Showing posts with label sun. Show all posts
Wednesday, February 2, 2011
Man's First Ever Whole Sun View Coming Soon From STEREO
On Super Bowl SUNday - Feb 6, 2011; the two NASA STEREO spacecraft will see the entire Sun ! Super Bowl SUNday will truly mark a milestone for solar observations. On February 6, the two STEREO spacecrafts will be 180 degrees apart and for the next 8 years the STEREO spacecrafts and SDO will be able to observe the entire 360 degrees of the Sun. Credit: NASA.
"For the first time in the history of humankind we will be able to see the front and the far side of the sun ... Simultaneously," Madhulika Guhathakurta told Universe Today. Guhathakurta is the STEREO Program Scientist at NASA HQ. Courtesy of NASA’s solar duo of STEREO spacecraft.
Labels:
sun
Sun Blowing On Both Ends
Spaceweather.com has the details.
Our star is blowing up at opposite ends: On the left, a filament became unstable and crashed down in a loop of fire; on the right, a mid-sized flare detonated and shot a cloud of hot charged particles into space. View the movie here. The newly orbited SDO is studying the connection of simultaneous eruptions as having to do with massive magnetic field disturbances.
The huge gas ejection captured in this photo above isn’t headed our way. But we might get a blast of solar wind on February3 due to a "croissant-shaped hole” that has opened up over the sun’s surface.
A solar wind stream flowing from the indicated "coronal hole" (center top) should reach Earth on or about Feb. 3rd. Credit: SDO/AIA
Note this post references solar holes and solar flares ... they are not the same.
Our star is blowing up at opposite ends: On the left, a filament became unstable and crashed down in a loop of fire; on the right, a mid-sized flare detonated and shot a cloud of hot charged particles into space. View the movie here. The newly orbited SDO is studying the connection of simultaneous eruptions as having to do with massive magnetic field disturbances.
The huge gas ejection captured in this photo above isn’t headed our way. But we might get a blast of solar wind on February3 due to a "croissant-shaped hole” that has opened up over the sun’s surface.
A solar wind stream flowing from the indicated "coronal hole" (center top) should reach Earth on or about Feb. 3rd. Credit: SDO/AIA
Note this post references solar holes and solar flares ... they are not the same.
Labels:
sun
Tuesday, April 27, 2010
Popping Off
Recent images from NASA’s Solar Dynamics Observatory (SDO) are mesmerizing. The space observatory, launched on February 11th, 2010 from Cape Canaveral on an Atlas V-401 Rocket, is designed to monitor the Sun and how it influences space weather.
Seeing the sun like it's never been seen before:
AIA caught this beautiful prominence eruption only a few days after its doors were opened. The movie wobbles at the end because AIA's image stabilization system wasn't fully activated yet. Without the full stabilization capability, AIA would not be able to see the Sun at such high resolution. The actual wobble was extremely small - imagine a period in a newspaper seen from 100 meters away. Now move that period over a couple of words.
Seeing the sun like it's never been seen before:
AIA caught this beautiful prominence eruption only a few days after its doors were opened. The movie wobbles at the end because AIA's image stabilization system wasn't fully activated yet. Without the full stabilization capability, AIA would not be able to see the Sun at such high resolution. The actual wobble was extremely small - imagine a period in a newspaper seen from 100 meters away. Now move that period over a couple of words.
Sunday, March 22, 2009
Winter Is Not Over
No matter how much you might want it to be .... Yes the sun has crossed the equater, the vernal equinox, on it's way to the northern equinox, but it is still in deep slumber with no idea when it might return to all it's glory.

Medical workers help a stranded driver blocked by heavy snowfall near the Serbian city of Nis, 200 kms south of the capital Belgrade. Swept by strong crosswinds, the unrelenting snowfall left motorists stranded for up to 12 hours in both directions
Meanwhile, the sun did eat this nice tasty comet ... burp.

Explanation: The Sun destroyed this comet. Arcing toward a fiery fate, this Sungrazer comet was recorded by the SOHO spacecraft's Large Angle Spectrometric COronagraph(LASCO) on 1996 Dec. 23. LASCO uses an occulting disk, partially visible at the lower right, to block out the otherwise overwhelming solar disk allowing it to image the inner 5 million miles of the relatively faint corona. The comet is seen as its coma enters the bright equatorial solar wind region (oriented vertically). Spots and blemishes on the image are background stars and camera streaks caused by charged particles. Positioned in space to continuously observe the Sun, SOHO has now been use to discover over 1,500 comets, including numerous sungrazers. Based on their orbits, they are believed to belong to a family of comets created by successive break ups from a single large parent comet which passed very near the sun in the twelfth century. The Great Comet of 1965, Ikeya-Seki, was also a member of the Sungrazer family, coming within about 650,000 kilometers of the Sun's surface. Passing so close to the Sun, Sungrazers are subjected to destructive tidal forces along with intense solar heat. This comet, known as SOHO 6, did not survive.

Medical workers help a stranded driver blocked by heavy snowfall near the Serbian city of Nis, 200 kms south of the capital Belgrade. Swept by strong crosswinds, the unrelenting snowfall left motorists stranded for up to 12 hours in both directions
Meanwhile, the sun did eat this nice tasty comet ... burp.

Explanation: The Sun destroyed this comet. Arcing toward a fiery fate, this Sungrazer comet was recorded by the SOHO spacecraft's Large Angle Spectrometric COronagraph(LASCO) on 1996 Dec. 23. LASCO uses an occulting disk, partially visible at the lower right, to block out the otherwise overwhelming solar disk allowing it to image the inner 5 million miles of the relatively faint corona. The comet is seen as its coma enters the bright equatorial solar wind region (oriented vertically). Spots and blemishes on the image are background stars and camera streaks caused by charged particles. Positioned in space to continuously observe the Sun, SOHO has now been use to discover over 1,500 comets, including numerous sungrazers. Based on their orbits, they are believed to belong to a family of comets created by successive break ups from a single large parent comet which passed very near the sun in the twelfth century. The Great Comet of 1965, Ikeya-Seki, was also a member of the Sungrazer family, coming within about 650,000 kilometers of the Sun's surface. Passing so close to the Sun, Sungrazers are subjected to destructive tidal forces along with intense solar heat. This comet, known as SOHO 6, did not survive.
Labels:
sun,
Winter 2009
Sunday, January 11, 2009
Sun Is In A Funk
I add my conclusions -- as I see it, something changed in the sun's internal systems in October 2005. Are they cyclic, one time, what does it mean. No one knows, since this is the first time mankind has ever had the instruments and ability to observe the sun in any detailed way. Has it happened before, same answer, no one knows. I recall when we were building Apollo science instruments that were later placed on the moon -- What would we find, what discoveries could be made. Pretty much it all confirmed what we were seeing from Earth, various sounding rocket programs had shown what was happening, but not the why. there is a whole lot of stuff coming from the sun, being blown out into space and hitting our planet.
We also concluded these particles heated the upper Earth's atmosphere, and it expanded. Not from the moon, but the nature of the particles observed meant the conclusions were obvious.
The nerve of the sun doing this.
See the details at Watts Up With That. Some of Anthony's readers found the historical Ap data now going back to 1932, and it appears that is all the data we have on Ap. Using that data, here is the latest on the current lowest recorded Ap Index. The drop off happened in Oct 2005 and has continued trending lower since then. Will it go lower, who knows, but the trending says it will. For how long? Yes, maybe no.

What does all this mean? No one on planet Earth knows for sure. We simply do not have the data records for long enough, the instruments available for long enough, nor the understanding of the science involved.
I do think one think is safe to say, Earth's climate is not driven by CO2.
Pure conjecture on my part ...
Something to think about. I offer this as my own pet hypothesis, and like Al Gore, can prove none of it. About 5 million years ago, the Earth started cycling into and out of ice ages. The reasons and science driving this are not proved. I postulate that maybe the sun is a cyclic star, burning bright, then dimming, then bright. Not a huge swing, but enough to exhaust the available fuel for a period of time. Brighter, much more so than just the sunspot cycle would suggest. Suppose the sun burns real bright for 12,000 or so years, then relaxes into a lower level output for 100,000 years, then back to brighter. The ice ages. Who says the sun has to be a constant star.
We also concluded these particles heated the upper Earth's atmosphere, and it expanded. Not from the moon, but the nature of the particles observed meant the conclusions were obvious.
The nerve of the sun doing this.
See the details at Watts Up With That. Some of Anthony's readers found the historical Ap data now going back to 1932, and it appears that is all the data we have on Ap. Using that data, here is the latest on the current lowest recorded Ap Index. The drop off happened in Oct 2005 and has continued trending lower since then. Will it go lower, who knows, but the trending says it will. For how long? Yes, maybe no.

What does all this mean? No one on planet Earth knows for sure. We simply do not have the data records for long enough, the instruments available for long enough, nor the understanding of the science involved.
I do think one think is safe to say, Earth's climate is not driven by CO2.
Pure conjecture on my part ...
Something to think about. I offer this as my own pet hypothesis, and like Al Gore, can prove none of it. About 5 million years ago, the Earth started cycling into and out of ice ages. The reasons and science driving this are not proved. I postulate that maybe the sun is a cyclic star, burning bright, then dimming, then bright. Not a huge swing, but enough to exhaust the available fuel for a period of time. Brighter, much more so than just the sunspot cycle would suggest. Suppose the sun burns real bright for 12,000 or so years, then relaxes into a lower level output for 100,000 years, then back to brighter. The ice ages. Who says the sun has to be a constant star.
Labels:
sun
Wednesday, January 7, 2009
The Sun Has Changed
Monckton:Temperature Change and CO2 Change - A Scientific Briefing
And then there is this ...
Danger ahead as the Sun goes quiet
THE CHIEF REASON for skepticism at the official position on "global warming" is the overwhelming weight of evidence that the UN's climate panel, the IPCC, prodigiously exaggerates both the supposed causes and the imagined consequences of anthropogenic "global warming"; that too many of the exaggerations can be demonstrated to have been deliberate; and that the IPCC and other official sources have continued to rely even upon those exaggerations that have been definitively demonstrated in the literature to have been deliberate.
And then there is this ...
Danger ahead as the Sun goes quiet
THE sun's ability to shield the solar system from harmful cosmic rays could falter in the early 2020s, just in time to threaten the health of NASA astronauts as they return to the moon.The modern solar maximum, that's a term you probably hadn't heard in the last years, have you, has ended, that appears certain. Personally, I think the change seen in October 2005 portended the onset of a state change in the sun. But you are free to have your own opinions, that is what science is supposed to be. At least until we have provable fact to the contrary. Consensus in science is just so much meaningless gibberish.
As well as the 11-year cycle of sunspots and solar flares, the sun's activity experiences longer-term shifts lasting several decades. The sun is currently in a long-term high, having been relatively active for nearly a century, but it is not known when this will end.
Sunday, January 4, 2009
Sunspots: Make your Predictions
It's tough to tell what the future may hold, when you have so little understanding of the past. When we were studying the solar wind a short while back, hardly anyone knew what it was made of ... Lots of assumptions, suspicion, mostly correct, but little fact. Modern satellites have pulled back the blinders, partially. Just recently THEMIS discovered the probable mechanism that fires off an aurora. Who knows what they will find next. The beauty of exploring.
It's quite possible the macro cycle time of our star is much longer than we think. Why has our solar system, and principally the Earth, switched to alternating ice ages and inter-glacier periods over the last 5 million or so years. What change(s) has caused that? When will it end, the glacial cycle, or what will come next. Could Earth settle out hot, or settle out at cold, who knows.
It's all guess work, because our hard data of the past is so crude.
I think the drop in The Average Planetary Magnetic Index (Ap) in late 2005 was a key event, signifying a 'change of state' with our star. Fortunately, we had the instruments in place to witness the event, but has it ever happened before? Correlates with what other event(s). But then again, it's just my guess, I can prove nothing, and will have to sit and wait like the rest.
My guess, sunspot activity will continue low, and will very likely duplicate the 1912-13 low activity time-frame. But then what comes next?
It's quite possible the macro cycle time of our star is much longer than we think. Why has our solar system, and principally the Earth, switched to alternating ice ages and inter-glacier periods over the last 5 million or so years. What change(s) has caused that? When will it end, the glacial cycle, or what will come next. Could Earth settle out hot, or settle out at cold, who knows.
It's all guess work, because our hard data of the past is so crude.
I think the drop in The Average Planetary Magnetic Index (Ap) in late 2005 was a key event, signifying a 'change of state' with our star. Fortunately, we had the instruments in place to witness the event, but has it ever happened before? Correlates with what other event(s). But then again, it's just my guess, I can prove nothing, and will have to sit and wait like the rest.
My guess, sunspot activity will continue low, and will very likely duplicate the 1912-13 low activity time-frame. But then what comes next?
Labels:
sun
Friday, December 26, 2008
The Year Of The Spotless Sun
The 'Law of Logical Argument' as used by Al Gore: "Anything is possible if you don't know what you are talking about". Not sure who did this quote first, but it sure makes sense, doesn't it.Astronomers who count sunspots have announced that 2008 is now the "blankest year" of the Space Age.
"Sunspot counts are at a 50-year low," says solar physicist David Hathaway of the NASA Marshall Space Flight Center. "We're experiencing a deep minimum of the solar cycle."When talking about sunspot number, the data reliability is all over the map. Generally though, good data is available back to 1700, the quality of the data is considered as poor during 1700 - 1748, questionable during 1749 - 1817, good during 1818 - 1847, and reliable since 1848. So we have reliable data for the last 160 years out of our planets estimated 4.5-4.6 billion years of existence. Not what you would want if you were trying to make 'guaranteed' predictions - LOL.
Sunspot counting is an arcane art:
Here is how it's done --- Sum total of spotless days since the first day without spots, which is designated as month January 2004. We weren't talking spotless days in a row. The issue is cumulative spotless days in the transition to SC24, not consecutive spotless days -- Notice there is no time associated with the spotless day count. For reference, we are currently in the beginning phases of sunspot cycle 24(SSC24) and the ending phase of sunspot cycle 23(SSC23) -- "The Transition". For purposes of record keeping and analysis, the first spotless day was defined as month January 2004 for the transition from SSC23 to SSC24, which is ongoing. The first day a SSC24 sunspot showed was officially on January 4, 2008, for record keeping purposes, it was designated January 2008 as the month SSC24 started.
Bringing the data current with my manual analysis -- We had 446 spotless days as of the end of September, there were 20 spotless days in October and 16 in November, bringing us up to 482 as of the end of November. It is now December 25th, we added 22 more spotless days for December, so far, so we are up to 504. Breaking the 500 spotless day barrier before 2009 begins. Here is where you get the current 30 day count from. We have passed 1912 for total calendar year spotlessness as of December 25th with 260 spotless days in 2008 versus 253 in 1912. I am hoping that we don't repeat the 1912-1913 pattern since 1913 was the record year for spotlessness with 311.
UPDATE: It's all over -- The year that is, 2008 will bring the total number of sunspotless days this month to 28 and for the year to 266, clearly enough to make 2008, the second least active solar year since 1900. The count since the beginning of solar min now stands at 510 sunspotless days -- and counting. --- END UPDATE
We have to use the sun's calendar:
But, and it's a very big but -- You have to realize that the sun does not follow the Earth's calendar, so a better way to look at sunspots might be this method where the start months are synchronized and then graphs are made for analysis from those start points. Sunspot transition 14-15 was the most recent long minimum, where reliable data is available, so the closest in behavior we have to go by. If you do this type of sliding scale analysis, you find we have already passed the minimum number of spotless days in any 365 continuous day count, during several periods in 2008. So you could say we have already broken the record set in the 1912-1913 transition. So are we now going up, or is it we are now still going down. But -- Its all a very big if.
What the heck am I talking about:

Left: A photo of the sun taken Sept. 27, 2008. The face of the sun is "blank," i.e., completely unmarked by spots.
Right: The sun on Sept. 27, 2001. The sun's face is peppered with colossal sunspots, all crackling with solar flares.
Credit: ESA/NASA Solar and Heliospheric Observatory (SOHO)
Larger image of sun in 2008
Larger image of sun in 2001
It is a very quiet time on our sun. If you extrapolate the total spotless days of the current minimum transition, we are likely to see a century's old transition record broken early next year for spotless days of a sunspot cycle transition. Remember, we only have reliable data since 1848.
Today's sun -- Is the current image for when you click the link. Daily sunspot number historical records can be downloaded here.
Solar Minimum history in the making:
"This gives us a chance to study the sun without the complications of sunspots," says Dean Pesnell of the Goddard Space Flight Center. "Right now we have the best instrumentation in history looking at the sun. There is a whole fleet of spacecraft devoted to solar physics--SOHO, Hinode, ACE, STEREO and others. We're bound to learn new things during this long solar minimum."
Labels:
sun
Thursday, October 2, 2008
The Silent Sun’s Uncertain Course
The sun during more exicting times ...

by Clive Cookson

by Clive Cookson
Experts are reluctant to predict the consequences for Earth and its inhabitants because there are so many complex interactions between the Sun’s output, the planet’s atmosphere and magnetic field, and cosmic radiation from outer space. Some climatologists say that, over a period of decades, a quieter Sun means a cooler Earth, although the relationship between solar activity and climate is particularly controversial.The silent Sun’s uncertain course
Labels:
global warming hoax,
sun
Saturday, September 20, 2008
NASA To Discuss Conditions On And Surrounding The Sun
Observations show that in October 2005 the suns magnetic field decreased suddenly, and has not recovered since. It's quiet possible the sun has entered a phase not measured by man before, simply because man did not have that capability.
NASA announces a conference.
WASHINGTON — NASA will hold a media teleconference Tuesday, Sept. 23, at 12:30 p.m. EDT, to discuss data from the joint NASA and European Space Agency Ulysses mission that reveals the sun’s solar wind is at a 50-year low. The sun’s current state could result in changing conditions in the solar system.
Ulysses was the first mission to survey the space environment above and below the poles of the sun. The reams of data Ulysses returned have changed forever the way scientists view our star and its effects. The venerable spacecraft has lasted more than 17 years - almost four times its expected mission lifetime.
The panelists are:
– Ed Smith, NASA Ulysses project scientist and magnetic field instrument investigator, Jet Propulsion Laboratory, Pasadena, Calif.
– Dave McComas, Ulysses solar wind instrument principal investigator, Southwest Research Institute, San Antonio
– Karine Issautier, Ulysses radio wave lead investigator, Observatoire de Paris, Meudon, France
– Nancy Crooker, Research Professor, Boston University, Boston, Mass.
Reporters should call 866-617-1526 and use the pass code “sun” to participate in the teleconference. International media should call 1-210-795-0624.
To access visuals that will the accompany presentations, go to:
http://www.nasa.gov/topics/solarsystem/features/ulysses-20080923.html
Audio of the teleconference will be streamed live at:
http://www.nasa.gov/newsaudio
NASA announces a conference.
WASHINGTON — NASA will hold a media teleconference Tuesday, Sept. 23, at 12:30 p.m. EDT, to discuss data from the joint NASA and European Space Agency Ulysses mission that reveals the sun’s solar wind is at a 50-year low. The sun’s current state could result in changing conditions in the solar system.
Ulysses was the first mission to survey the space environment above and below the poles of the sun. The reams of data Ulysses returned have changed forever the way scientists view our star and its effects. The venerable spacecraft has lasted more than 17 years - almost four times its expected mission lifetime.
The panelists are:
– Ed Smith, NASA Ulysses project scientist and magnetic field instrument investigator, Jet Propulsion Laboratory, Pasadena, Calif.
– Dave McComas, Ulysses solar wind instrument principal investigator, Southwest Research Institute, San Antonio
– Karine Issautier, Ulysses radio wave lead investigator, Observatoire de Paris, Meudon, France
– Nancy Crooker, Research Professor, Boston University, Boston, Mass.
Reporters should call 866-617-1526 and use the pass code “sun” to participate in the teleconference. International media should call 1-210-795-0624.
To access visuals that will the accompany presentations, go to:
http://www.nasa.gov/topics/solarsystem/features/ulysses-20080923.html
Audio of the teleconference will be streamed live at:
http://www.nasa.gov/newsaudio
Labels:
sun
Monday, September 1, 2008
Sun Has First Spotless Month Since June 1913
The sun has gone and done it, shut down it's spots, why no one knows. All we can do is observe. Unlike the global warming hoaxers, real scientist admit when they don't know what the future has in store. The only thing we can do, that would be to take observations from the past, and try and forecast the future. But, it's nothing more than a guess.
Anthony Watts, at WattsUpWithThat has the details of this event. Another post worthy of the time to read is The Sun Remains In a Magnetic Funk, hey you can even learn about the Babacock modelof how the sun works.
Up until a couple of years ago, even isolated episodes of hot weather were proclaimed as "proof" of global warming. Now, however, we have endless reports of unusually cold weather from all over the world but they are always attributed to "normal variation". Could it be clearer that we are dealing with Leftist politics rather than science?
Anthony Watts, at WattsUpWithThat has the details of this event. Another post worthy of the time to read is The Sun Remains In a Magnetic Funk, hey you can even learn about the Babacock modelof how the sun works.
Up until a couple of years ago, even isolated episodes of hot weather were proclaimed as "proof" of global warming. Now, however, we have endless reports of unusually cold weather from all over the world but they are always attributed to "normal variation". Could it be clearer that we are dealing with Leftist politics rather than science?
Labels:
sun
Friday, August 15, 2008
A New Ice Age Is Coming ?
May well be ...
Stay away from political science
While the drive by media, Al Gore and politicized scientific bodies like the IPCC scaremonger about the perils of global warming and demand the poor and middle class pay CO2 taxes, both hard scientific data and circumstantial evidence points to a clear cooling trend. How is it going around your neck of the woods these days?
There is an unpublished paper by William Livingston and Matthew Penn of the National Solar Observatory in Tucson, which predicts, based on mostly statistical analysis of sunspot patterns, that sunspots will all but vanish after 2015.
Read the cited article here. The William Livingston and Matthew Penn science paper is available here
If you are interested, the UK’s Armagh Observatory is here, and the USA's National Solar Observatory is here. Lots of interesting science stuff at both.
In the end ... we don't know, real scientists know that
I think it safe to say, like most everything about the Earth's climate, the bottom line is we do not know, we do not know how the climate science works, we do not know what drives Earth's climate. But in the end, it's a much better guess that it's the sun, rather than some phony science about CO2 cocked up by a group of politicians and their enablers in the UN and national governments worldwide. One thing we do know, the current warming is not caused by man generating CO2 -- that we do know. There is no hard science that backs up the IPCC's AGW theory, except other theories and computer models of how they think it should work. It's all smoke and mirrors, not very well done at that.
If you are interested in how the AGW hoax has been perpetrated, go here and examine a key element of the hoax, the infamous IPCC hockey stick of reconstructed temperature.
A top observatory that has been measuring sun cycles for over 200 years predicts that global temperatures will drop by two degrees over the next two decades as solar activity grinds to a halt and the planet drastically cools down, potentially heralding the onset of a new ice age.A top observatory(UK’s Armagh Observatory) that has been measuring sun cycles for over 200 years predicts that global temperatures will drop by two degrees over the next two decades as solar activity grinds to a halt and the planet drastically cools down, potentially heralding the onset of a new ice age.
While the mass media, Al Gore and politicized bodies like the IPCC scaremonger about the perils of global warming and demand the poor and middle class pay CO2 taxes, both hard scientific data and circumstantial evidence points to a clear cooling trend.
Following the end of the Sun’s most active period in over 11,000 years, the last 10 years have displayed a clear cooling trend as temperatures post-1998 leveled out and are now plummeting.
China recently experienced its coldest winter in 100 years while northeast America was hit by record snow levels and Britain suffered its coldest April in decades as late-blooming daffodils were pounded with hail and snow on an almost daily basis. The British summer has also left many yearning for global warming, with temperatures in June and July rarely struggling to get over 16 degrees and on one occasion even dropping as low as 9 degrees in the middle of the afternoon.
Stay away from political science
While the drive by media, Al Gore and politicized scientific bodies like the IPCC scaremonger about the perils of global warming and demand the poor and middle class pay CO2 taxes, both hard scientific data and circumstantial evidence points to a clear cooling trend. How is it going around your neck of the woods these days?
There is an unpublished paper by William Livingston and Matthew Penn of the National Solar Observatory in Tucson, which predicts, based on mostly statistical analysis of sunspot patterns, that sunspots will all but vanish after 2015.
Read the cited article here. The William Livingston and Matthew Penn science paper is available here
If you are interested, the UK’s Armagh Observatory is here, and the USA's National Solar Observatory is here. Lots of interesting science stuff at both.
In the end ... we don't know, real scientists know that
I think it safe to say, like most everything about the Earth's climate, the bottom line is we do not know, we do not know how the climate science works, we do not know what drives Earth's climate. But in the end, it's a much better guess that it's the sun, rather than some phony science about CO2 cocked up by a group of politicians and their enablers in the UN and national governments worldwide. One thing we do know, the current warming is not caused by man generating CO2 -- that we do know. There is no hard science that backs up the IPCC's AGW theory, except other theories and computer models of how they think it should work. It's all smoke and mirrors, not very well done at that.
If you are interested in how the AGW hoax has been perpetrated, go here and examine a key element of the hoax, the infamous IPCC hockey stick of reconstructed temperature.
Monday, June 16, 2008
Sun Now

Click for source
![]() | ![]() | ![]() | ![]() |
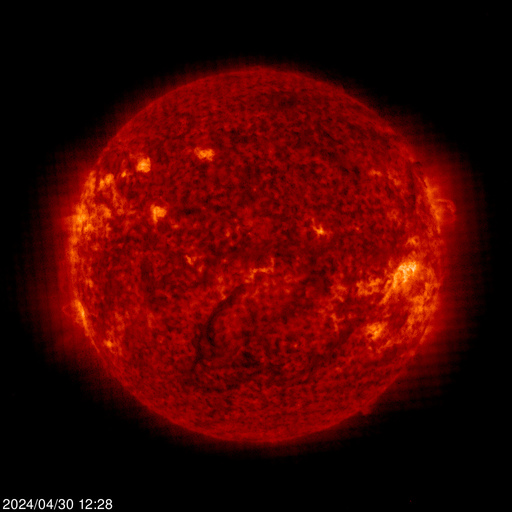
Images: From left to right: EIT 171, EIT 195, EIT 284, EIT 304
EIT (Extreme ultraviolet Imaging Telescope) images the solar atmosphere at several wavelengths, and therefore, shows solar material at different temperatures. In the images taken at 304 Angstrom the bright material is at 60,000 to 80,000 degrees Kelvin. In those taken at 171 Angstrom, at 1 million degrees. 195 Angstrom images correspond to about 1.5 million Kelvin, 284 Angstrom to 2 million degrees. The hotter the temperature, the higher you look in the solar atmosphere.
Visit SOHO Explore! to learn more about the Sun.
Labels:
sun
Sunday, June 15, 2008
Ulysses Mission Ends
Ulysses ends its career after revealing that the magnetic field emanating from the sun's poles is much weaker than previously observed. This could mean the upcoming solar maximum period will be less intense than in recent history.-- NASA


After 17 years of service studying our star, so long old friend. Here is the main website where you can read about the history and science. Ulysses has changed the way we see our star forever and how it interacts with the surrounding universe.
Thursday, June 12, 2008
How The Sun Used To Be

An EIT 304Å image captures a pair of curving erupting prominences on 28 June 2000 -- Prominences are huge clouds of relatively cool dense plasma suspended in the Sun's hot, thin corona. At times, they can erupt, escaping the Sun's atmosphere. Emission in this spectral line shows the upper chromosphere at a temperature of about 60,000 degrees K. Every feature in the image traces magnetic field structure. The hottest areas appear almost white, while the darker red areas indicate cooler temperatures.
We miss you, some are saying you are dead.
Labels:
sun
Thursday, June 5, 2008
Total Solar Irradiance
The elephant is missing from the room.
This Solar Irradiance Reconstruction is by Judith Lean, Naval Research Laboratory. Some supporting articles here and here from Steve Miloy's great site, Junk Science.
Now comes some new perspective from -- The Death Blow to AGW by Stephen Wilde.
This Solar Irradiance Reconstruction is by Judith Lean, Naval Research Laboratory. Some supporting articles here and here from Steve Miloy's great site, Junk Science.Now comes some new perspective from -- The Death Blow to AGW by Stephen Wilde.
It is true that, as the alarmists say, since 1961 the average level of TSI has been approximately level if one averages out the peaks and troughs from solar cycles 19 through to 23.You should carefully read the linked works if you are really interested in the science of what is happening to Earth's climate. Leaving out the obvious influence of the sun is ludicrous in any climate modelling endeavour. Remember, models are not science, they are just predictions, anyone can make predictions, fewer can do rigorous science.
However, those solar cycles show substantially higher levels of TSI than have ever previously occurred in the historical record.
Because of the height of the TSI level one cannot simply ignore it as the IPCC and the modellers have done.
The critical issue is that having achieved such high levels of TSI by 1961 the sun was already producing more heat than was required to maintain a stable Earth temperature. On that basis alone the theory of AGW cannot be sustained and should now die.
Throughout the period 1961 to about 2001, there was a steady cumulative net warming effect from the sun. The fact that the TSI was, on average, level during that period is entirely irrelevant and misleading.
It is hardly likely that such a high level of TSI compared to historical levels is going to have no effect at all on global temperature changes and indeed during most of that period there was an enhanced period of positive Pacific Decadal Oscillation that imparted increasing warmth to the atmosphere. My link below to article 1041 contains details of my view that the sun drives the various oceanic oscillations which in turn drive global temperature variations with all other influences including CO2 being minor and often cancelling themselves out leaving the solar/oceanic driver supreme.
Labels:
global warming hoax,
sun
Wednesday, May 21, 2008
New Solar Cycle Not Packing Much Punch
Many solar scientists expected the new sunspot cycle to be a whopper, a prolonged solar tantrum that could fry satellites and raise hell with earthly communications, the power grid and modern electronics.Today the sun is quite with two little dots of cycle 23 polarity.
But there's scant proof Sunspot Cycle 24 is even here, let alone the debut of big trouble.
So far there have been just a couple minor zits on the face of the sun to suggest the old cycle is over and the new one is coming.
The roughly 11-year cycle of sunspot activity should have bottomed out last year, the end of Cycle 23 and the beginning of Cycle 24. That would have put the peak in new sunspot activity around 2012.
But a dud sunspot cycle would not necessarily make it a boring period, especially for two solar scientists with the Tucson-based National Solar Observatory.
Two years ago, William Livingston and Matt Penn wrote a paper for the journal Science predicting that this could not only be a dud sunspot cycle, but the start of another extended down period in solar activity. It was based on their analysis of weakening sunspot intensity and said sunspots might vanish by 2015.
And here's the punch line: That last long-term down period, 1645-1715, coincided with the Little Ice Age, a period of bitter cold winters.
That kind of talk could ruffle some feathers in this time of climate change and global warming, starring man-made carbon dioxide as the devil.
Source:
Labels:
sun
Friday, April 4, 2008
Sun Climate Link
Want to know how the cyclical nature of the sun might effect Earth's climate, here is a must read series -- part I and part II.
Labels:
climate link,
global warming,
hoax,
sun
Saturday, March 29, 2008
Sunspot Cycle 23 -- The Movie
Anthony Watts has a great post on Sunspot Cycle 23. It is a flash animation movie showing the progression of sun spots through the later part of the cycle. Both the sunspot progression and the prediction plot is included. Go here.
Labels:
sun,
Sunspot Predicition,
sunspots
Thursday, March 27, 2008
Maunder's Butterfly Diagram

Throughout the solar_cycle, the latitude of sunspot occurrence varies with an interesting pattern. The plot above shows the latitude of sunspot occurrence versus time in years. Sunspots are typically confined to an equatorial belt between -35 degrees south and +35 degrees north latitude.
At the beginning of a new solar cycle, sunspots tend to form at high latitudes, but as the cycle reaches a maximum (large numbers of sunspots) the spots form at lower latitudes. Near the minimum of the cycle, sunspots appear even closer to the equator, and as a new cycle starts again, sunspots again appear at high latitudes.
This recurrent behavior of sunspots gives rise to the ``butterfly'' pattern shown, and was first discovered by Edward Maunder in 1904. The reason for this sunspot migration pattern is unknown. Understanding this pattern could tell us something about how the Sun's internal magnetic field is generated.
You should be able to tell when solar cycle 24 starts by looking at the latitude of the sunspots that form. Today's current crop of sunspots are at or near the sun's equator, so you can conclude they are leftover from cycle 23. The magnetic polarity of the 'new spots' also switches, but it's harder to measure that parameter. However, the measurements confirm, the spots are leftovers.
Subscribe to:
Posts (Atom)